Australia Pavers Equipment Market Size & Outlook, 2025-2033
Australia Pavers Equipment Market Highlights
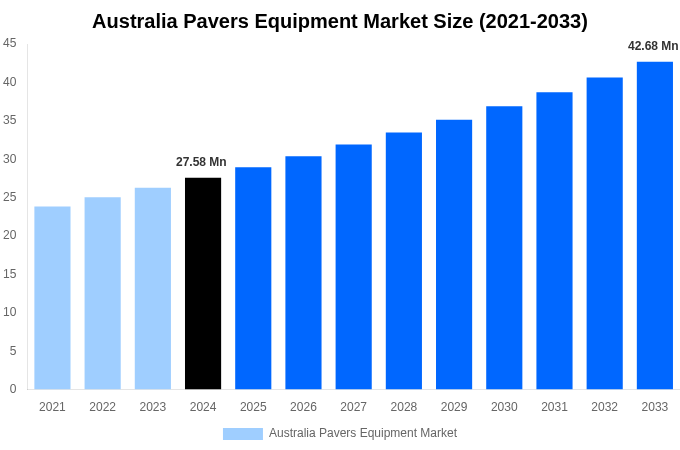
- According to Market Strides analysis, the Australia Pavers Equipment Market size was USD 27.58 Million in 2024 and is projected to reach USD 42.68 Million by 2033.
- The Australia market is projected to grow at a CAGR of 4.91% between 2026 and 2033.
- By segment, Tracked Pavers emerged as the largest By Type in terms of market size in 2024.
- Tracked Pavers is anticipated to remain the most attractive By Type segment, recording the fastest growth during the forecast period.
Source: MS Analysis Company Publications, Primary Interviews.
Other Key Findings
- Australia accounted for 0.88% of the global Pavers Equipment Market size in 2024.
- By 2033, United States is expected to remain the top global market in terms of size.
- Within Asia Pacific, China is forecasted to dominate the regional Pavers Equipment Market size by 2033.
- South East Asia will be the fastest-growing market in Asia Pacific, projected to achieve USD 2121.92 Million by 2033.
Report Summary
| Report Scope | Details |
|---|---|
| Base Year for Study | 2024 |
| Study Period | 2021-2033 |
| Historical Period | 2021-2023 |
| Forecast Period | 2025-2033 |
| Market Size In 2024 | USD 27.58 Million |
| Market Size In 2033 | USD 42.68 Million |
| Largest segment | Tracked Pavers |
| Units | Revenue in USD Million |
| CAGR | 4.91% (2025-2033) |
| Segmnetation Covered | |
| By Type |
|
| By Paving Width |
|
| By Power Rating |
|
| By Application |
|
| By End-User |
|
| Report Coverage | Revenue Forecast, Competitive Landscape, Growth Factors, Environment & Regulatory Landscape and Trends |
Australia Pavers Equipment Market By Type 2025-2033 (USD Million)
| By Type | 2021 | 2022 | 2023 | 2024 | 2025 | 2026 | 2027 | 2028 | 2029 | 2030 | 2031 | 2032 | 2033 |
|---|---|---|---|---|---|---|---|---|---|---|---|---|---|
| Tracked Pavers | XX.x | XX.x | XX.x | 12.43 | XX.x | XX.x | XX.x | XX.x | XX.x | XX.x | XX.x | XX.x | XX.x |
| Wheeled Pavers | XX.x | XX.x | XX.x | XX.x | XX.x | XX.x | XX.x | XX.x | XX.x | XX.x | XX.x | XX.x | XX.x |
| Mini Pavers | XX.x | XX.x | XX.x | XX.x | XX.x | XX.x | XX.x | XX.x | XX.x | XX.x | XX.x | XX.x | XX.x |
| Total | XX.x | XX.x | XX.x | XX.x | XX.x | XX.x | XX.x | XX.x | XX.x | XX.x | XX.x | XX.x | XX.x |
Source: MS Analysis Company Publications, Primary Interviews.
Australia Pavers Equipment Market By Paving Width 2025-2033 (USD Million)
| By Paving Width | 2021 | 2022 | 2023 | 2024 | 2025 | 2026 | 2027 | 2028 | 2029 | 2030 | 2031 | 2032 | 2033 |
|---|---|---|---|---|---|---|---|---|---|---|---|---|---|
| Less than 2.5 m | XX.x | XX.x | XX.x | 14.37 | XX.x | XX.x | XX.x | XX.x | XX.x | XX.x | XX.x | XX.x | XX.x |
| 2.5–5 m | XX.x | XX.x | XX.x | XX.x | XX.x | XX.x | XX.x | XX.x | XX.x | XX.x | XX.x | XX.x | XX.x |
| Above 5 m | XX.x | XX.x | XX.x | XX.x | XX.x | XX.x | XX.x | XX.x | XX.x | XX.x | XX.x | XX.x | XX.x |
| Total | XX.x | XX.x | XX.x | XX.x | XX.x | XX.x | XX.x | XX.x | XX.x | XX.x | XX.x | XX.x | XX.x |
Source: MS Analysis Company Publications, Primary Interviews.
Australia Pavers Equipment Market By Power Rating 2025-2033 (USD Million)
| By Power Rating | 2021 | 2022 | 2023 | 2024 | 2025 | 2026 | 2027 | 2028 | 2029 | 2030 | 2031 | 2032 | 2033 |
|---|---|---|---|---|---|---|---|---|---|---|---|---|---|
| Up to 100 HP | XX.x | XX.x | XX.x | 13.59 | XX.x | XX.x | XX.x | XX.x | XX.x | XX.x | XX.x | XX.x | XX.x |
| 101–200 HP | XX.x | XX.x | XX.x | XX.x | XX.x | XX.x | XX.x | XX.x | XX.x | XX.x | XX.x | XX.x | XX.x |
| Above 200 HP | XX.x | XX.x | XX.x | XX.x | XX.x | XX.x | XX.x | XX.x | XX.x | XX.x | XX.x | XX.x | XX.x |
| Total | XX.x | XX.x | XX.x | XX.x | XX.x | XX.x | XX.x | XX.x | XX.x | XX.x | XX.x | XX.x | XX.x |
Source: MS Analysis Company Publications, Primary Interviews.
Australia Pavers Equipment Market By Application 2025-2033 (USD Million)
| By Application | 2021 | 2022 | 2023 | 2024 | 2025 | 2026 | 2027 | 2028 | 2029 | 2030 | 2031 | 2032 | 2033 |
|---|---|---|---|---|---|---|---|---|---|---|---|---|---|
| Road Construction | XX.x | XX.x | XX.x | 11.81 | XX.x | XX.x | XX.x | XX.x | XX.x | XX.x | XX.x | XX.x | XX.x |
| Airport Runways | XX.x | XX.x | XX.x | XX.x | XX.x | XX.x | XX.x | XX.x | XX.x | XX.x | XX.x | XX.x | XX.x |
| Bridges | XX.x | XX.x | XX.x | XX.x | XX.x | XX.x | XX.x | XX.x | XX.x | XX.x | XX.x | XX.x | XX.x |
| Parking Lots | XX.x | XX.x | XX.x | XX.x | XX.x | XX.x | XX.x | XX.x | XX.x | XX.x | XX.x | XX.x | XX.x |
| Industrial Yards | XX.x | XX.x | XX.x | XX.x | XX.x | XX.x | XX.x | XX.x | XX.x | XX.x | XX.x | XX.x | XX.x |
| Total | XX.x | XX.x | XX.x | XX.x | XX.x | XX.x | XX.x | XX.x | XX.x | XX.x | XX.x | XX.x | XX.x |
Source: MS Analysis Company Publications, Primary Interviews.
Australia Pavers Equipment Market By End-User 2025-2033 (USD Million)
| By End-User | 2021 | 2022 | 2023 | 2024 | 2025 | 2026 | 2027 | 2028 | 2029 | 2030 | 2031 | 2032 | 2033 |
|---|---|---|---|---|---|---|---|---|---|---|---|---|---|
| Government | XX.x | XX.x | XX.x | 12.43 | XX.x | XX.x | XX.x | XX.x | XX.x | XX.x | XX.x | XX.x | XX.x |
| Private Contractors | XX.x | XX.x | XX.x | XX.x | XX.x | XX.x | XX.x | XX.x | XX.x | XX.x | XX.x | XX.x | XX.x |
| Rental Companies | XX.x | XX.x | XX.x | XX.x | XX.x | XX.x | XX.x | XX.x | XX.x | XX.x | XX.x | XX.x | XX.x |
| Total | XX.x | XX.x | XX.x | XX.x | XX.x | XX.x | XX.x | XX.x | XX.x | XX.x | XX.x | XX.x | XX.x |
Source: MS Analysis Company Publications, Primary Interviews.
Author :
Market Strides Research Team
The Market Strides Research Team delivers concise, data-driven insights across Construction & Manufacturing, Energy & Power, and Machinery & Equipment markets. With expertise covering materials, machinery, automation, infrastructure, power systems, renewables, and industrial technologies, the team provides reliable research and clear market intelligence for global businesses and decision-makers.
Related Reports
Report Details
| Author | Market Strides Research Team |
| Format | PDF & Excel |
| Language | English |
| Published | Nov, 2025 |
USD 3150
Buy Now
"A sample report is available for preview before making a purchase decision."
Send Me the Sample Report