Asia Pacific Sustainable Infrastructure Market Size & Outlook, 2025-2033
Asia Pacific Sustainable Infrastructure Market Highlights
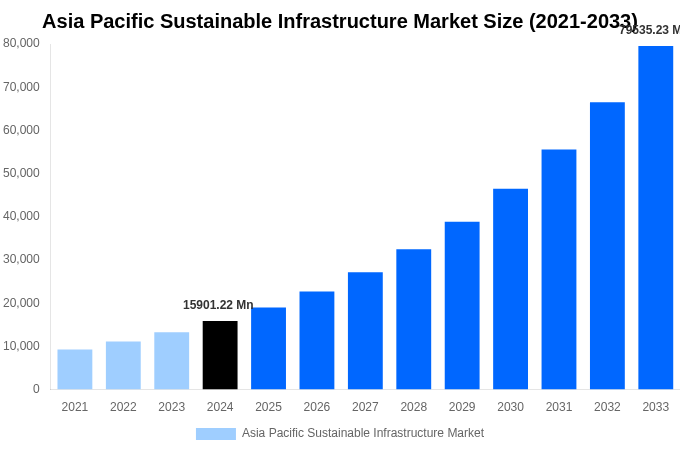
- Market Strides analysis indicates that the Asia Pacific Sustainable Infrastructure Market size, which was USD 15901.23 Million in 2024, is projected to attain USD 77,715.75 Million by 2033.
- The market is expected to register a CAGR of 19.20% over the period 2026–2033.
- In 2024, Energy Infrastructure emerged as the dominant Sustainable Infrastructure Type based on market size.
- Transportation Infrastructure is projected to register the fastest growth, positioning it as the most attractive Sustainable Infrastructure Type segment over the forecast horizon.
Source: MS Analysis Company Publications, Primary Interviews.
Other Key Findings
- The global Sustainable Infrastructure Market size saw Asia Pacific holding a share of 25.94% in 2024.
- United States is forecasted to account for the leading share of the global market by 2033.
- In Asia Pacific, South East Asia is forecasted to be the fastest-expanding market, projected to reach USD 2121.92 Million by 2033.
Report Summary
| Report Scope | Details |
|---|---|
| Base Year for Study | 2024 |
| Study Period | 2021-2033 |
| Historical Period | 2021-2023 |
| Forecast Period | 2025-2033 |
| Market Size In 2024 | USD 15901.23 Million |
| Market Size In 2033 | USD 77,715.75 Million |
| Largest segment | Energy Infrastructure |
| Units | Revenue in USD Million |
| CAGR | 19.20% (2025-2033) |
| Segmnetation Covered | |
| Asia Pacific |
|
| Sustainable Infrastructure Type |
|
| By Application |
|
| Report Coverage | Revenue Forecast, Competitive Landscape, Growth Factors, Environment & Regulatory Landscape and Trends |
Asia Pacific Sustainable Infrastructure Market Country 2025-2033 (USD Million)
| Asia Pacific | 2021 | 2022 | 2023 | 2024 | 2025 | 2026 | 2027 | 2028 | 2029 | 2030 | 2031 | 2032 | 2033 |
|---|---|---|---|---|---|---|---|---|---|---|---|---|---|
| China | XX.x | XX.x | XX.x | 6120.38 | XX.x | XX.x | XX.x | XX.x | XX.x | XX.x | XX.x | XX.x | XX.x |
| India | XX.x | XX.x | XX.x | XX.x | XX.x | XX.x | XX.x | XX.x | XX.x | XX.x | XX.x | XX.x | XX.x |
| Japan | XX.x | XX.x | XX.x | XX.x | XX.x | XX.x | XX.x | XX.x | XX.x | XX.x | XX.x | XX.x | XX.x |
| Korea | XX.x | XX.x | XX.x | XX.x | XX.x | XX.x | XX.x | XX.x | XX.x | XX.x | XX.x | XX.x | XX.x |
| Taiwan | XX.x | XX.x | XX.x | XX.x | XX.x | XX.x | XX.x | XX.x | XX.x | XX.x | XX.x | XX.x | XX.x |
| Australia | XX.x | XX.x | XX.x | XX.x | XX.x | XX.x | XX.x | XX.x | XX.x | XX.x | XX.x | XX.x | XX.x |
| Singapore | XX.x | XX.x | XX.x | XX.x | XX.x | XX.x | XX.x | XX.x | XX.x | XX.x | XX.x | XX.x | XX.x |
| South East Asia | XX.x | XX.x | XX.x | XX.x | XX.x | XX.x | XX.x | XX.x | XX.x | XX.x | XX.x | XX.x | XX.x |
| Total | XX.x | XX.x | XX.x | XX.x | XX.x | XX.x | XX.x | XX.x | XX.x | XX.x | XX.x | XX.x | XX.x |
Source: MS Analysis Company Publications, Primary Interviews.
Asia Pacific Sustainable Infrastructure Market Sustainable Infrastructure Type 2025-2033 (USD Million)
| Sustainable Infrastructure Type | 2021 | 2022 | 2023 | 2024 | 2025 | 2026 | 2027 | 2028 | 2029 | 2030 | 2031 | 2032 | 2033 |
|---|---|---|---|---|---|---|---|---|---|---|---|---|---|
| Energy Infrastructure | XX.x | XX.x | XX.x | 5349.17 | XX.x | XX.x | XX.x | XX.x | XX.x | XX.x | XX.x | XX.x | XX.x |
| Built Environment / Buildings | XX.x | XX.x | XX.x | XX.x | XX.x | XX.x | XX.x | XX.x | XX.x | XX.x | XX.x | XX.x | XX.x |
| Transportation Infrastructure | XX.x | XX.x | XX.x | XX.x | XX.x | XX.x | XX.x | XX.x | XX.x | XX.x | XX.x | XX.x | XX.x |
| Water and Waste Infrastructure | XX.x | XX.x | XX.x | XX.x | XX.x | XX.x | XX.x | XX.x | XX.x | XX.x | XX.x | XX.x | XX.x |
| Digital and Smart Infrastructure | XX.x | XX.x | XX.x | XX.x | XX.x | XX.x | XX.x | XX.x | XX.x | XX.x | XX.x | XX.x | XX.x |
| Resilience and Emerging Infrastructure | XX.x | XX.x | XX.x | XX.x | XX.x | XX.x | XX.x | XX.x | XX.x | XX.x | XX.x | XX.x | XX.x |
| Total | XX.x | XX.x | XX.x | XX.x | XX.x | XX.x | XX.x | XX.x | XX.x | XX.x | XX.x | XX.x | XX.x |
Source: MS Analysis Company Publications, Primary Interviews.
Asia Pacific Sustainable Infrastructure Market By Application 2025-2033 (USD Million)
| By Application | 2021 | 2022 | 2023 | 2024 | 2025 | 2026 | 2027 | 2028 | 2029 | 2030 | 2031 | 2032 | 2033 |
|---|---|---|---|---|---|---|---|---|---|---|---|---|---|
| Residential | XX.x | XX.x | XX.x | 7098.3 | XX.x | XX.x | XX.x | XX.x | XX.x | XX.x | XX.x | XX.x | XX.x |
| Commercial and Institutional | XX.x | XX.x | XX.x | XX.x | XX.x | XX.x | XX.x | XX.x | XX.x | XX.x | XX.x | XX.x | XX.x |
| Industrial | XX.x | XX.x | XX.x | XX.x | XX.x | XX.x | XX.x | XX.x | XX.x | XX.x | XX.x | XX.x | XX.x |
| Municipal and Public Sector | XX.x | XX.x | XX.x | XX.x | XX.x | XX.x | XX.x | XX.x | XX.x | XX.x | XX.x | XX.x | XX.x |
| Others | XX.x | XX.x | XX.x | XX.x | XX.x | XX.x | XX.x | XX.x | XX.x | XX.x | XX.x | XX.x | XX.x |
| Total | XX.x | XX.x | XX.x | XX.x | XX.x | XX.x | XX.x | XX.x | XX.x | XX.x | XX.x | XX.x | XX.x |
Source: MS Analysis Company Publications, Primary Interviews.
Author :
Market Strides Research Team
The Market Strides Research Team delivers concise, data-driven insights across Construction & Manufacturing, Energy & Power, and Machinery & Equipment markets. With expertise covering materials, machinery, automation, infrastructure, power systems, renewables, and industrial technologies, the team provides reliable research and clear market intelligence for global businesses and decision-makers.
Related Reports
Report Details
| Author | Market Strides Research Team |
| Format | PDF & Excel |
| Language | English |
| Published | Nov, 2025 |
USD 3550
Buy Now
"A sample report is available for preview before making a purchase decision."