Asia Pacific Printable Battery Market Size & Outlook, 2025-2033
Asia Pacific Printable Battery Market Highlights
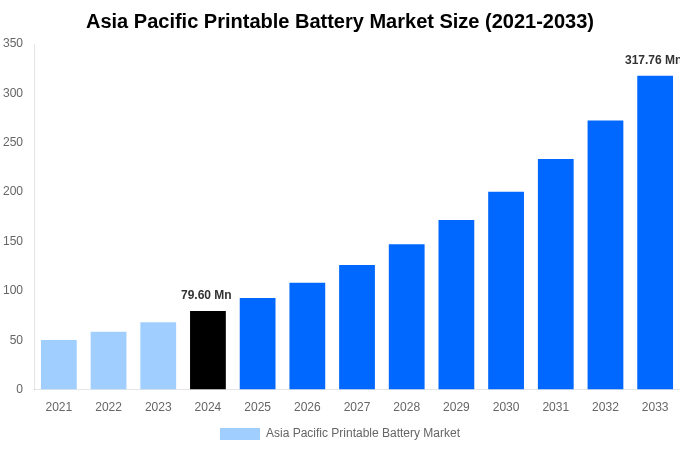
- According to Market Strides analysis, the Asia Pacific Printable Battery Market size stood at USD 79.59 Million in 2024 and is forecasted to reach USD 323.34 Million by 2033.
- The market is projected to grow at a CAGR of 16.80% between 2026 and 2033.
- By segment, Consumer Electronics was the leading Application in terms of market size in 2024.
- Smart Packaging is expected to be the most lucrative Application segment, exhibiting the fastest growth throughout the forecast period.
Source: MS Analysis Company Publications, Primary Interviews.
Other Key Findings
- Asia Pacific represented 24.24% of the global Printable Battery Market size in 2024.
- By 2033, United States is estimated to hold the largest position in the global market in terms of size.
- South East Asia is estimated to remain the fastest-growing market in Asia Pacific, advancing to USD 2121.92 Million by 2033.
Report Summary
| Report Scope | Details |
|---|---|
| Base Year for Study | 2024 |
| Study Period | 2021-2033 |
| Historical Period | 2021-2023 |
| Forecast Period | 2025-2033 |
| Market Size In 2024 | USD 79.59 Million |
| Market Size In 2033 | USD 323.34 Million |
| Largest segment | Consumer Electronics |
| Units | Revenue in USD Million |
| CAGR | 16.80% (2025-2033) |
| Segmnetation Covered | |
| Asia Pacific |
|
| Application |
|
| Technology |
|
| End Use Industry |
|
| Report Coverage | Revenue Forecast, Competitive Landscape, Growth Factors, Environment & Regulatory Landscape and Trends |
Asia Pacific Printable Battery Market Country 2025-2033 (USD Million)
| Asia Pacific | 2021 | 2022 | 2023 | 2024 | 2025 | 2026 | 2027 | 2028 | 2029 | 2030 | 2031 | 2032 | 2033 |
|---|---|---|---|---|---|---|---|---|---|---|---|---|---|
| China | XX.x | XX.x | XX.x | 30.25 | XX.x | XX.x | XX.x | XX.x | XX.x | XX.x | XX.x | XX.x | XX.x |
| India | XX.x | XX.x | XX.x | XX.x | XX.x | XX.x | XX.x | XX.x | XX.x | XX.x | XX.x | XX.x | XX.x |
| Japan | XX.x | XX.x | XX.x | XX.x | XX.x | XX.x | XX.x | XX.x | XX.x | XX.x | XX.x | XX.x | XX.x |
| Korea | XX.x | XX.x | XX.x | XX.x | XX.x | XX.x | XX.x | XX.x | XX.x | XX.x | XX.x | XX.x | XX.x |
| Taiwan | XX.x | XX.x | XX.x | XX.x | XX.x | XX.x | XX.x | XX.x | XX.x | XX.x | XX.x | XX.x | XX.x |
| Australia | XX.x | XX.x | XX.x | XX.x | XX.x | XX.x | XX.x | XX.x | XX.x | XX.x | XX.x | XX.x | XX.x |
| Singapore | XX.x | XX.x | XX.x | XX.x | XX.x | XX.x | XX.x | XX.x | XX.x | XX.x | XX.x | XX.x | XX.x |
| South East Asia | XX.x | XX.x | XX.x | XX.x | XX.x | XX.x | XX.x | XX.x | XX.x | XX.x | XX.x | XX.x | XX.x |
| Total | XX.x | XX.x | XX.x | XX.x | XX.x | XX.x | XX.x | XX.x | XX.x | XX.x | XX.x | XX.x | XX.x |
Source: MS Analysis Company Publications, Primary Interviews.
Asia Pacific Printable Battery Market Application 2025-2033 (USD Million)
| Application | 2021 | 2022 | 2023 | 2024 | 2025 | 2026 | 2027 | 2028 | 2029 | 2030 | 2031 | 2032 | 2033 |
|---|---|---|---|---|---|---|---|---|---|---|---|---|---|
| Consumer Electronics | XX.x | XX.x | XX.x | 28.25 | XX.x | XX.x | XX.x | XX.x | XX.x | XX.x | XX.x | XX.x | XX.x |
| Wearable Devices | XX.x | XX.x | XX.x | XX.x | XX.x | XX.x | XX.x | XX.x | XX.x | XX.x | XX.x | XX.x | XX.x |
| Medical Devices | XX.x | XX.x | XX.x | XX.x | XX.x | XX.x | XX.x | XX.x | XX.x | XX.x | XX.x | XX.x | XX.x |
| Smart Packaging | XX.x | XX.x | XX.x | XX.x | XX.x | XX.x | XX.x | XX.x | XX.x | XX.x | XX.x | XX.x | XX.x |
| Telecommunications | XX.x | XX.x | XX.x | XX.x | XX.x | XX.x | XX.x | XX.x | XX.x | XX.x | XX.x | XX.x | XX.x |
| Total | XX.x | XX.x | XX.x | XX.x | XX.x | XX.x | XX.x | XX.x | XX.x | XX.x | XX.x | XX.x | XX.x |
Source: MS Analysis Company Publications, Primary Interviews.
Asia Pacific Printable Battery Market Technology 2025-2033 (USD Million)
| Technology | 2021 | 2022 | 2023 | 2024 | 2025 | 2026 | 2027 | 2028 | 2029 | 2030 | 2031 | 2032 | 2033 |
|---|---|---|---|---|---|---|---|---|---|---|---|---|---|
| Printed Lithium-ion Batteries | XX.x | XX.x | XX.x | 32.11 | XX.x | XX.x | XX.x | XX.x | XX.x | XX.x | XX.x | XX.x | XX.x |
| Printed Solid-state Batteries | XX.x | XX.x | XX.x | XX.x | XX.x | XX.x | XX.x | XX.x | XX.x | XX.x | XX.x | XX.x | XX.x |
| Organic Printed Batteries | XX.x | XX.x | XX.x | XX.x | XX.x | XX.x | XX.x | XX.x | XX.x | XX.x | XX.x | XX.x | XX.x |
| Printed Supercapacitors | XX.x | XX.x | XX.x | XX.x | XX.x | XX.x | XX.x | XX.x | XX.x | XX.x | XX.x | XX.x | XX.x |
| Total | XX.x | XX.x | XX.x | XX.x | XX.x | XX.x | XX.x | XX.x | XX.x | XX.x | XX.x | XX.x | XX.x |
Source: MS Analysis Company Publications, Primary Interviews.
Asia Pacific Printable Battery Market End Use Industry 2025-2033 (USD Million)
| End Use Industry | 2021 | 2022 | 2023 | 2024 | 2025 | 2026 | 2027 | 2028 | 2029 | 2030 | 2031 | 2032 | 2033 |
|---|---|---|---|---|---|---|---|---|---|---|---|---|---|
| Electronics | XX.x | XX.x | XX.x | 31.44 | XX.x | XX.x | XX.x | XX.x | XX.x | XX.x | XX.x | XX.x | XX.x |
| Healthcare | XX.x | XX.x | XX.x | XX.x | XX.x | XX.x | XX.x | XX.x | XX.x | XX.x | XX.x | XX.x | XX.x |
| Automotive | XX.x | XX.x | XX.x | XX.x | XX.x | XX.x | XX.x | XX.x | XX.x | XX.x | XX.x | XX.x | XX.x |
| Telecom | XX.x | XX.x | XX.x | XX.x | XX.x | XX.x | XX.x | XX.x | XX.x | XX.x | XX.x | XX.x | XX.x |
| Retail | XX.x | XX.x | XX.x | XX.x | XX.x | XX.x | XX.x | XX.x | XX.x | XX.x | XX.x | XX.x | XX.x |
| Total | XX.x | XX.x | XX.x | XX.x | XX.x | XX.x | XX.x | XX.x | XX.x | XX.x | XX.x | XX.x | XX.x |
Source: MS Analysis Company Publications, Primary Interviews.
Author :
Market Strides Research Team
The Market Strides Research Team delivers concise, data-driven insights across Construction & Manufacturing, Energy & Power, and Machinery & Equipment markets. With expertise covering materials, machinery, automation, infrastructure, power systems, renewables, and industrial technologies, the team provides reliable research and clear market intelligence for global businesses and decision-makers.
Related Reports
Report Details
| Author | Market Strides Research Team |
| Format | PDF & Excel |
| Language | English |
| Published | Nov, 2025 |
USD 3550
Buy Now
"A sample report is available for preview before making a purchase decision."
Send Me the Sample Report