North America Printable Battery Market Size & Outlook, 2025-2033
North America Printable Battery Market Highlights
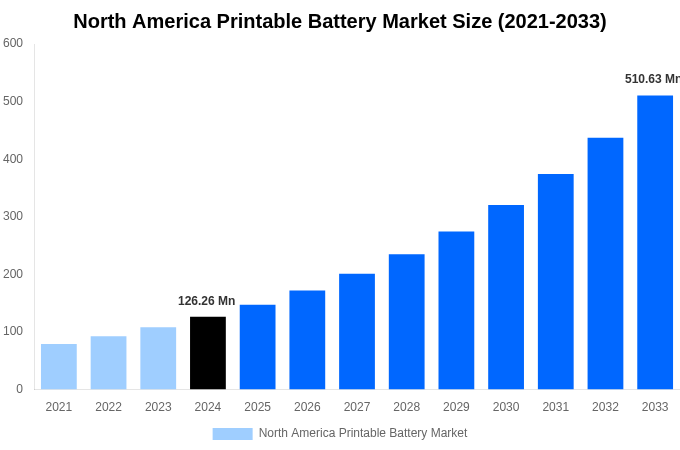
- Based on Market Strides findings, the North America Printable Battery Market size reached USD 126.25 Million in 2024 and is expected to grow to USD 503.07 Million by 2033.
- During 2026–2033, the market is forecasted to advance at a CAGR of 16.66%.
- Consumer Electronics represented the largest share of the Application market in terms of size in 2024.
- Among the Application segments, Wearable Devices is forecasted to achieve the highest growth and remain the most lucrative through the forecast period.
Source: MS Analysis Company Publications, Primary Interviews.
Other Key Findings
- North America represented 38.18% of the global Printable Battery Market size in 2024.
- By 2033, United States is estimated to hold the largest position in the global market in terms of size.
- United States is estimated to remain the fastest-growing market in North America, advancing to USD 30555.21 Million by 2033.
Report Summary
| Report Scope | Details |
|---|---|
| Base Year for Study | 2024 |
| Study Period | 2021-2033 |
| Historical Period | 2021-2023 |
| Forecast Period | 2025-2033 |
| Market Size In 2024 | USD 126.25 Million |
| Market Size In 2033 | USD 503.07 Million |
| Largest segment | Consumer Electronics |
| Units | Revenue in USD Million |
| CAGR | 16.66% (2025-2033) |
| Segmnetation Covered | |
| North America |
|
| Application |
|
| Technology |
|
| End Use Industry |
|
| Report Coverage | Revenue Forecast, Competitive Landscape, Growth Factors, Environment & Regulatory Landscape and Trends |
North America Printable Battery Market Country 2025-2033 (USD Million)
| North America | 2021 | 2022 | 2023 | 2024 | 2025 | 2026 | 2027 | 2028 | 2029 | 2030 | 2031 | 2032 | 2033 |
|---|---|---|---|---|---|---|---|---|---|---|---|---|---|
| United States | XX.x | XX.x | XX.x | 91.13 | XX.x | XX.x | XX.x | XX.x | XX.x | XX.x | XX.x | XX.x | XX.x |
| Canada | XX.x | XX.x | XX.x | XX.x | XX.x | XX.x | XX.x | XX.x | XX.x | XX.x | XX.x | XX.x | XX.x |
| Total | XX.x | XX.x | XX.x | XX.x | XX.x | XX.x | XX.x | XX.x | XX.x | XX.x | XX.x | XX.x | XX.x |
Source: MS Analysis Company Publications, Primary Interviews.
North America Printable Battery Market Application 2025-2033 (USD Million)
| Application | 2021 | 2022 | 2023 | 2024 | 2025 | 2026 | 2027 | 2028 | 2029 | 2030 | 2031 | 2032 | 2033 |
|---|---|---|---|---|---|---|---|---|---|---|---|---|---|
| Consumer Electronics | XX.x | XX.x | XX.x | 55.11 | XX.x | XX.x | XX.x | XX.x | XX.x | XX.x | XX.x | XX.x | XX.x |
| Wearable Devices | XX.x | XX.x | XX.x | XX.x | XX.x | XX.x | XX.x | XX.x | XX.x | XX.x | XX.x | XX.x | XX.x |
| Medical Devices | XX.x | XX.x | XX.x | XX.x | XX.x | XX.x | XX.x | XX.x | XX.x | XX.x | XX.x | XX.x | XX.x |
| Smart Packaging | XX.x | XX.x | XX.x | XX.x | XX.x | XX.x | XX.x | XX.x | XX.x | XX.x | XX.x | XX.x | XX.x |
| Telecommunications | XX.x | XX.x | XX.x | XX.x | XX.x | XX.x | XX.x | XX.x | XX.x | XX.x | XX.x | XX.x | XX.x |
| Total | XX.x | XX.x | XX.x | XX.x | XX.x | XX.x | XX.x | XX.x | XX.x | XX.x | XX.x | XX.x | XX.x |
Source: MS Analysis Company Publications, Primary Interviews.
North America Printable Battery Market Technology 2025-2033 (USD Million)
| Technology | 2021 | 2022 | 2023 | 2024 | 2025 | 2026 | 2027 | 2028 | 2029 | 2030 | 2031 | 2032 | 2033 |
|---|---|---|---|---|---|---|---|---|---|---|---|---|---|
| Printed Lithium-ion Batteries | XX.x | XX.x | XX.x | 59.3 | XX.x | XX.x | XX.x | XX.x | XX.x | XX.x | XX.x | XX.x | XX.x |
| Printed Solid-state Batteries | XX.x | XX.x | XX.x | XX.x | XX.x | XX.x | XX.x | XX.x | XX.x | XX.x | XX.x | XX.x | XX.x |
| Organic Printed Batteries | XX.x | XX.x | XX.x | XX.x | XX.x | XX.x | XX.x | XX.x | XX.x | XX.x | XX.x | XX.x | XX.x |
| Printed Supercapacitors | XX.x | XX.x | XX.x | XX.x | XX.x | XX.x | XX.x | XX.x | XX.x | XX.x | XX.x | XX.x | XX.x |
| Total | XX.x | XX.x | XX.x | XX.x | XX.x | XX.x | XX.x | XX.x | XX.x | XX.x | XX.x | XX.x | XX.x |
Source: MS Analysis Company Publications, Primary Interviews.
North America Printable Battery Market End Use Industry 2025-2033 (USD Million)
| End Use Industry | 2021 | 2022 | 2023 | 2024 | 2025 | 2026 | 2027 | 2028 | 2029 | 2030 | 2031 | 2032 | 2033 |
|---|---|---|---|---|---|---|---|---|---|---|---|---|---|
| Electronics | XX.x | XX.x | XX.x | 44.46 | XX.x | XX.x | XX.x | XX.x | XX.x | XX.x | XX.x | XX.x | XX.x |
| Healthcare | XX.x | XX.x | XX.x | XX.x | XX.x | XX.x | XX.x | XX.x | XX.x | XX.x | XX.x | XX.x | XX.x |
| Automotive | XX.x | XX.x | XX.x | XX.x | XX.x | XX.x | XX.x | XX.x | XX.x | XX.x | XX.x | XX.x | XX.x |
| Telecom | XX.x | XX.x | XX.x | XX.x | XX.x | XX.x | XX.x | XX.x | XX.x | XX.x | XX.x | XX.x | XX.x |
| Retail | XX.x | XX.x | XX.x | XX.x | XX.x | XX.x | XX.x | XX.x | XX.x | XX.x | XX.x | XX.x | XX.x |
| Total | XX.x | XX.x | XX.x | XX.x | XX.x | XX.x | XX.x | XX.x | XX.x | XX.x | XX.x | XX.x | XX.x |
Source: MS Analysis Company Publications, Primary Interviews.
Author :
Market Strides Research Team
The Market Strides Research Team delivers concise, data-driven insights across Construction & Manufacturing, Energy & Power, and Machinery & Equipment markets. With expertise covering materials, machinery, automation, infrastructure, power systems, renewables, and industrial technologies, the team provides reliable research and clear market intelligence for global businesses and decision-makers.
Related Reports
Report Details
| Author | Market Strides Research Team |
| Format | PDF & Excel |
| Language | English |
| Published | Nov, 2025 |
USD 3550
Buy Now
"A sample report is available for preview before making a purchase decision."