South East Asia Solar Inverter Market Size & Outlook, 2025-2033
South East Asia Solar Inverter Market Highlights
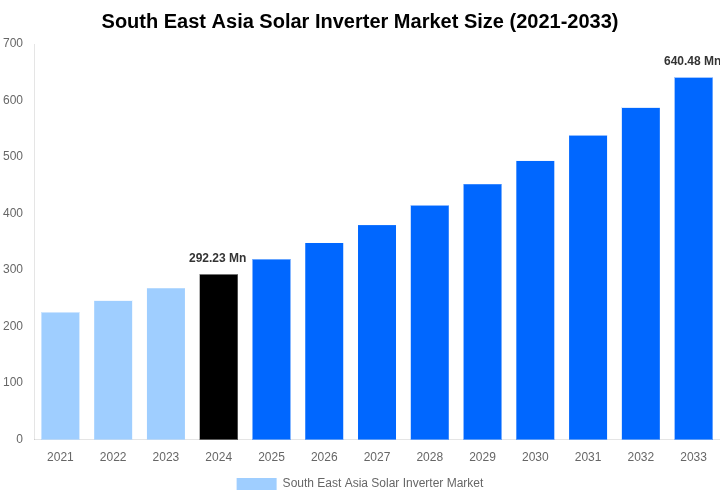
- Market Strides analysis indicates that the South East Asia Solar Inverter Market size, valued at USD 292.23 Million in 2024, is expected to expand to USD 640.48 Million by 2033.
- The South East Asia market is forecasted to expand at a CAGR of 9.09% spanning 2026–2033.
- Central Inverter held the leading position among Product Type segments in 2024, based on market size.
- String Inverter is projected to post the fastest growth rate, sustaining its position as the most attractive Product Type segment during the forecast horizon.
Source: MS Analysis Company Publications, Primary Interviews.
Other Key Findings
- South East Asia contributed 2.41% to the global Solar Inverter Market size in 2024.
- By 2033, United States is forecasted to remain the largest global market for Solar Inverter Market.
- In Asia Pacific, China is projected to capture the leading share of market by 2033.
- Among Asia Pacific markets, South East Asia is expected to post the fastest growth, reaching USD 2121.92 Million by 2033.
Report Summary
| Report Scope | Details |
|---|---|
| Base Year for Study | 2024 |
| Study Period | 2021-2033 |
| Historical Period | 2021-2023 |
| Forecast Period | 2025-2033 |
| Market Size In 2024 | USD 292.23 Million |
| Market Size In 2033 | USD 640.48 Million |
| Largest segment | Central Inverter |
| Units | Revenue in USD Million |
| CAGR | 9.09% (2025-2033) |
| Segmnetation Covered | |
| Product Type |
|
| Connection |
|
| Phase |
|
| End User |
|
| Nominal Power Output |
|
| Nominal Output Voltage |
|
| Report Coverage | Revenue Forecast, Competitive Landscape, Growth Factors, Environment & Regulatory Landscape and Trends |
South East Asia Solar Inverter Market Product Type 2025-2033 (USD Million)
| Product Type | 2021 | 2022 | 2023 | 2024 | 2025 | 2026 | 2027 | 2028 | 2029 | 2030 | 2031 | 2032 | 2033 |
|---|---|---|---|---|---|---|---|---|---|---|---|---|---|
| Central Inverter | XX.x | XX.x | XX.x | 132.73 | XX.x | XX.x | XX.x | XX.x | XX.x | XX.x | XX.x | XX.x | XX.x |
| String Inverter | XX.x | XX.x | XX.x | XX.x | XX.x | XX.x | XX.x | XX.x | XX.x | XX.x | XX.x | XX.x | XX.x |
| Micro Inverter | XX.x | XX.x | XX.x | XX.x | XX.x | XX.x | XX.x | XX.x | XX.x | XX.x | XX.x | XX.x | XX.x |
| Others | XX.x | XX.x | XX.x | XX.x | XX.x | XX.x | XX.x | XX.x | XX.x | XX.x | XX.x | XX.x | XX.x |
| Total | XX.x | XX.x | XX.x | XX.x | XX.x | XX.x | XX.x | XX.x | XX.x | XX.x | XX.x | XX.x | XX.x |
Source: MS Analysis Company Publications, Primary Interviews.
South East Asia Solar Inverter Market Connection 2025-2033 (USD Million)
| Connection | 2021 | 2022 | 2023 | 2024 | 2025 | 2026 | 2027 | 2028 | 2029 | 2030 | 2031 | 2032 | 2033 |
|---|---|---|---|---|---|---|---|---|---|---|---|---|---|
| On-grid | XX.x | XX.x | XX.x | 189.63 | XX.x | XX.x | XX.x | XX.x | XX.x | XX.x | XX.x | XX.x | XX.x |
| Off-grid | XX.x | XX.x | XX.x | XX.x | XX.x | XX.x | XX.x | XX.x | XX.x | XX.x | XX.x | XX.x | XX.x |
| Total | XX.x | XX.x | XX.x | XX.x | XX.x | XX.x | XX.x | XX.x | XX.x | XX.x | XX.x | XX.x | XX.x |
Source: MS Analysis Company Publications, Primary Interviews.
South East Asia Solar Inverter Market Phase 2025-2033 (USD Million)
| Phase | 2021 | 2022 | 2023 | 2024 | 2025 | 2026 | 2027 | 2028 | 2029 | 2030 | 2031 | 2032 | 2033 |
|---|---|---|---|---|---|---|---|---|---|---|---|---|---|
| Single Phase | XX.x | XX.x | XX.x | 166.86 | XX.x | XX.x | XX.x | XX.x | XX.x | XX.x | XX.x | XX.x | XX.x |
| Three Phase | XX.x | XX.x | XX.x | XX.x | XX.x | XX.x | XX.x | XX.x | XX.x | XX.x | XX.x | XX.x | XX.x |
| Total | XX.x | XX.x | XX.x | XX.x | XX.x | XX.x | XX.x | XX.x | XX.x | XX.x | XX.x | XX.x | XX.x |
Source: MS Analysis Company Publications, Primary Interviews.
South East Asia Solar Inverter Market End User 2025-2033 (USD Million)
| End User | 2021 | 2022 | 2023 | 2024 | 2025 | 2026 | 2027 | 2028 | 2029 | 2030 | 2031 | 2032 | 2033 |
|---|---|---|---|---|---|---|---|---|---|---|---|---|---|
| Residential | XX.x | XX.x | XX.x | 119.14 | XX.x | XX.x | XX.x | XX.x | XX.x | XX.x | XX.x | XX.x | XX.x |
| Commercial | XX.x | XX.x | XX.x | XX.x | XX.x | XX.x | XX.x | XX.x | XX.x | XX.x | XX.x | XX.x | XX.x |
| Industrial | XX.x | XX.x | XX.x | XX.x | XX.x | XX.x | XX.x | XX.x | XX.x | XX.x | XX.x | XX.x | XX.x |
| Utilities | XX.x | XX.x | XX.x | XX.x | XX.x | XX.x | XX.x | XX.x | XX.x | XX.x | XX.x | XX.x | XX.x |
| Total | XX.x | XX.x | XX.x | XX.x | XX.x | XX.x | XX.x | XX.x | XX.x | XX.x | XX.x | XX.x | XX.x |
Source: MS Analysis Company Publications, Primary Interviews.
South East Asia Solar Inverter Market Nominal Power Output 2025-2033 (USD Million)
| Nominal Power Output | 2021 | 2022 | 2023 | 2024 | 2025 | 2026 | 2027 | 2028 | 2029 | 2030 | 2031 | 2032 | 2033 |
|---|---|---|---|---|---|---|---|---|---|---|---|---|---|
| Less than or equal to 0.5 kW | XX.x | XX.x | XX.x | 103.36 | XX.x | XX.x | XX.x | XX.x | XX.x | XX.x | XX.x | XX.x | XX.x |
| 0.5 - 3 kW | XX.x | XX.x | XX.x | XX.x | XX.x | XX.x | XX.x | XX.x | XX.x | XX.x | XX.x | XX.x | XX.x |
| 3 - 33 kW | XX.x | XX.x | XX.x | XX.x | XX.x | XX.x | XX.x | XX.x | XX.x | XX.x | XX.x | XX.x | XX.x |
| 33 - 110 kW | XX.x | XX.x | XX.x | XX.x | XX.x | XX.x | XX.x | XX.x | XX.x | XX.x | XX.x | XX.x | XX.x |
| 110 kW | XX.x | XX.x | XX.x | XX.x | XX.x | XX.x | XX.x | XX.x | XX.x | XX.x | XX.x | XX.x | XX.x |
| Total | XX.x | XX.x | XX.x | XX.x | XX.x | XX.x | XX.x | XX.x | XX.x | XX.x | XX.x | XX.x | XX.x |
Source: MS Analysis Company Publications, Primary Interviews.
South East Asia Solar Inverter Market Nominal Output Voltage 2025-2033 (USD Million)
| Nominal Output Voltage | 2021 | 2022 | 2023 | 2024 | 2025 | 2026 | 2027 | 2028 | 2029 | 2030 | 2031 | 2032 | 2033 |
|---|---|---|---|---|---|---|---|---|---|---|---|---|---|
| Less than or equal to 230 V | XX.x | XX.x | XX.x | 116.89 | XX.x | XX.x | XX.x | XX.x | XX.x | XX.x | XX.x | XX.x | XX.x |
| 230 - 400 V | XX.x | XX.x | XX.x | XX.x | XX.x | XX.x | XX.x | XX.x | XX.x | XX.x | XX.x | XX.x | XX.x |
| 400 - 600 V | XX.x | XX.x | XX.x | XX.x | XX.x | XX.x | XX.x | XX.x | XX.x | XX.x | XX.x | XX.x | XX.x |
| 600 V | XX.x | XX.x | XX.x | XX.x | XX.x | XX.x | XX.x | XX.x | XX.x | XX.x | XX.x | XX.x | XX.x |
| Total | XX.x | XX.x | XX.x | XX.x | XX.x | XX.x | XX.x | XX.x | XX.x | XX.x | XX.x | XX.x | XX.x |
Source: MS Analysis Company Publications, Primary Interviews.
Author :
Market Strides Research Team
The Market Strides Research Team delivers concise, data-driven insights across Construction & Manufacturing, Energy & Power, and Machinery & Equipment markets. With expertise covering materials, machinery, automation, infrastructure, power systems, renewables, and industrial technologies, the team provides reliable research and clear market intelligence for global businesses and decision-makers.
Related Reports
Report Details
| Author | Market Strides Research Team |
| Format | PDF & Excel |
| Language | English |
| Published | Nov, 2025 |
USD 3150
Buy Now
"A sample report is available for preview before making a purchase decision."